Covid-19 Live Tracker
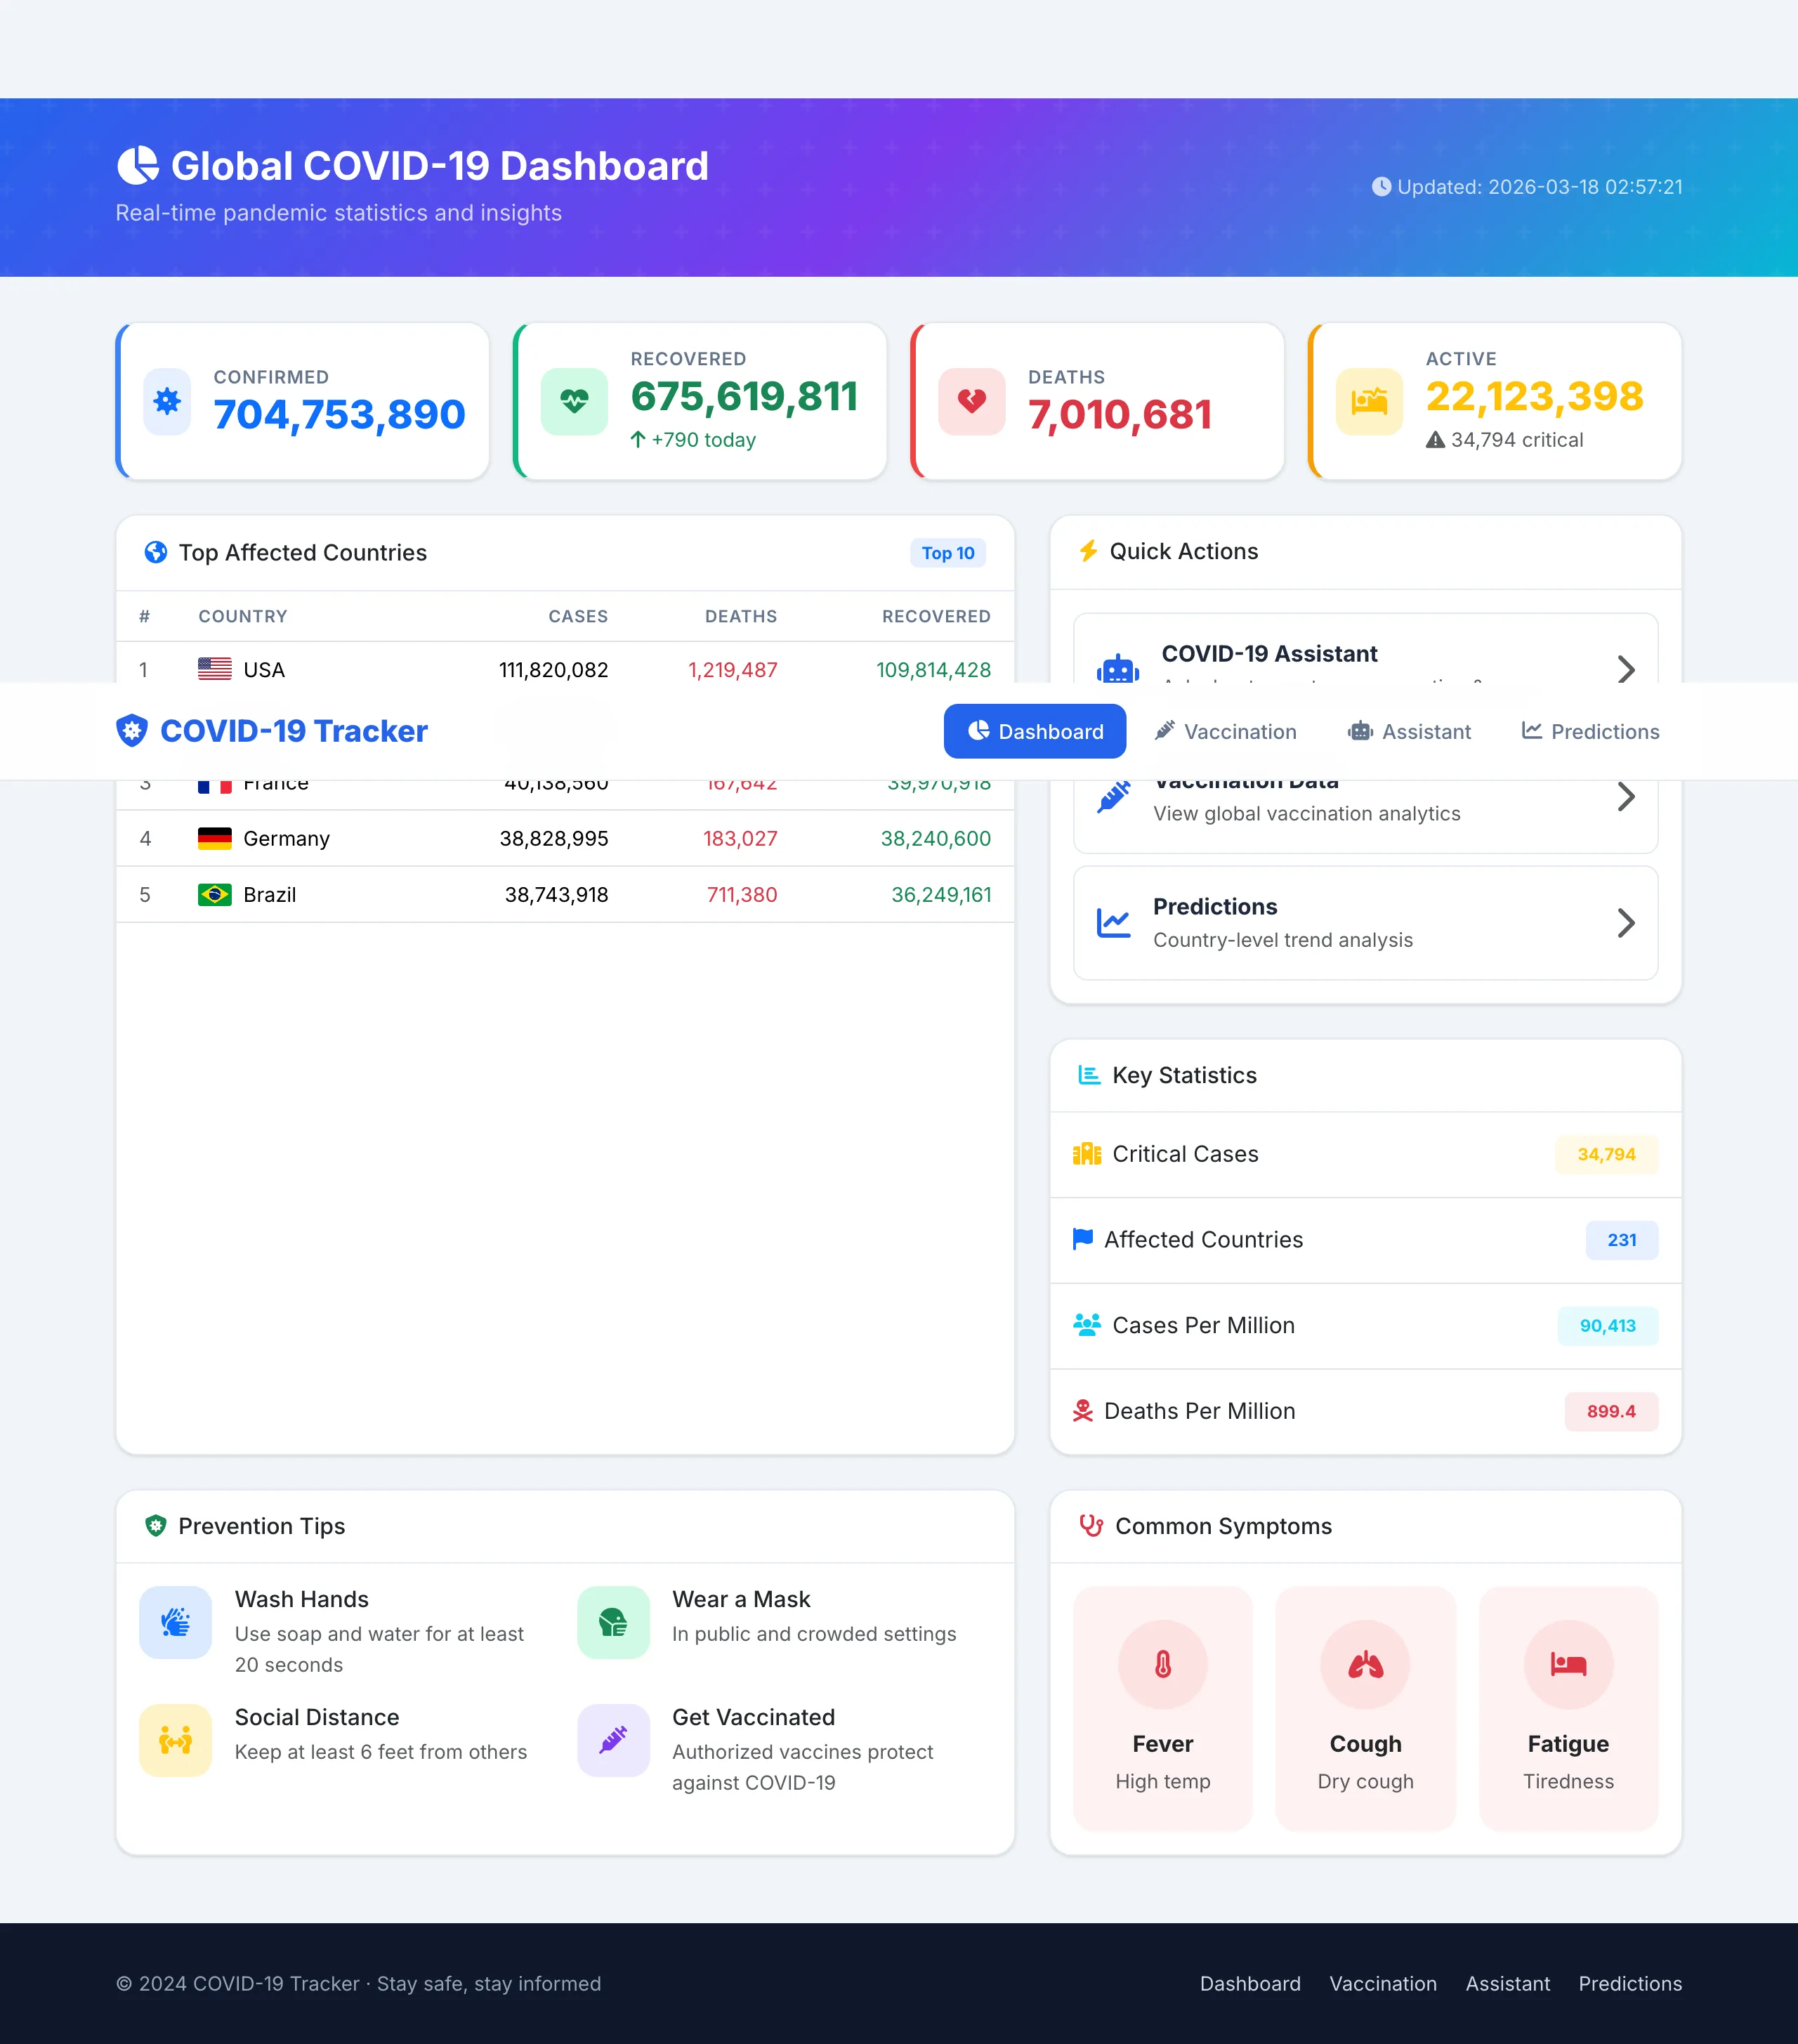
Real-time pandemic dashboard with symptom-triage chatbot
- Countries tracked
- 190+
- Data refresh cadence
- 24 h
- First contentful paint
- < 2 s
The Problem
Early-pandemic data was scattered across JHU, WHO, and government feeds, updated inconsistently, and nearly useless to non-epidemiologists who just needed to answer: should I be worried today?
Stack
- Python
- Django
- Chart.js
- Scikit-learn
- Pandas
- JavaScript
- HTML/CSS
What I Shipped
- Auto-refreshing country & city drill-downs with Chart.js time-series.
- Recovery-rate regression model surfacing 7-day trend deltas.
- Symptom-triage chatbot with escalation prompts toward local health resources.
- Lightweight caching layer to stay under free-tier API quotas.
Lessons Learned
Public-interest dashboards live or die on trust signals. Exposing the data-source timestamp and raw counts side-by-side did more for credibility than any fancier visualization.